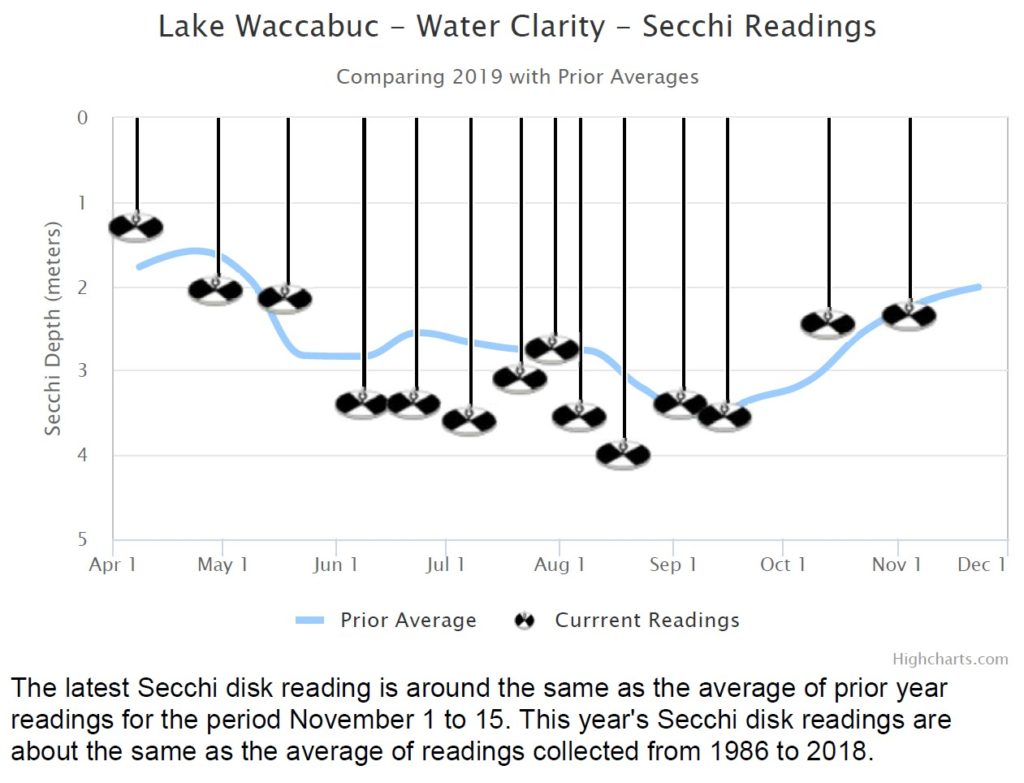
One of the important measurements of water quality is water clarity. Water clarity, or the depth you can see into the water, is a shortcut to how much algae is in the water, with its many implications for health and aesthetics. Graphs summarizing our findings in 2019 are below. The clarity changed as the months progressed, and the changes differed by lake, despite common geology and weather. Aren’t lakes fascinating?
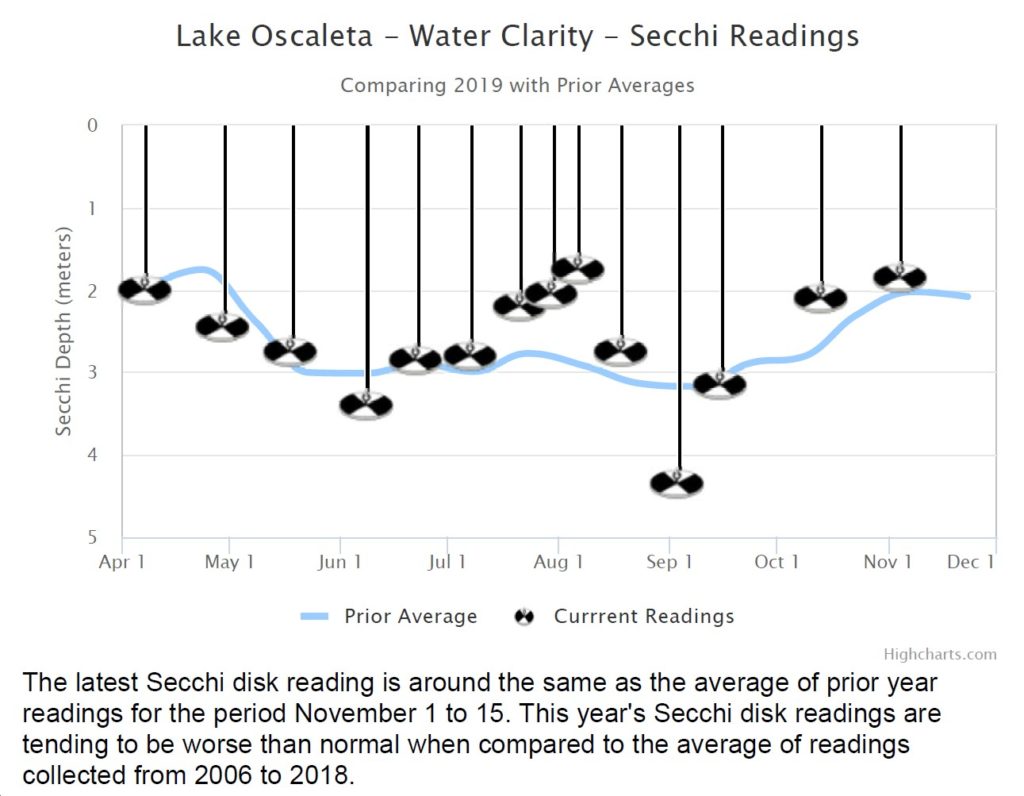
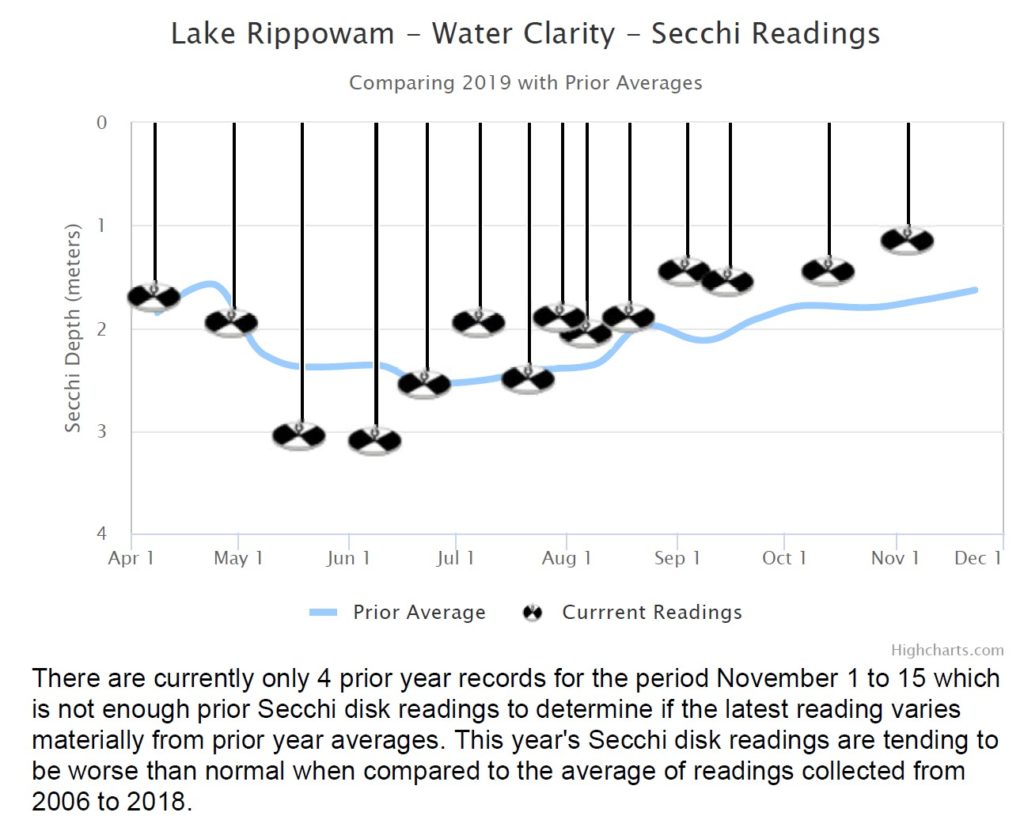
Three charts show the water clarity in our lakes in 2019 compared to the average of past years’ measurements. Symbols closer to the bottom of the chart are better clarity – just like you can see deeper into the water if the water is clearer.
All of our lakes had better than typical clarity in June – but from then, paths diverged. Our historical readings have a pretty wide range, so it takes a fairly large deviation from normal to have the statistics say that the water clarity was better or worse than normal. Unlike 2018, when Waccabuc’s bloom impacted that lake, this year Waccabuc had normal clarity. Unfortunately, Oscaleta and Rippowam had worse than typical water clarity. Even so, we didn’t see an indication of a harmful bloom in those lakes.
Find out more about our water quality testing on our water quality page.